
Beginning April 15, 2023, new commercial and residential solar PV systems will lose up to 30% of their value compared to NEM 2.0.
The outlook for California commercial solar PV turns cloudier with this year’s onset of the new Net Billing Tariff (NBT), the CPUC’s successor to what has been known as Net Energy Metering (NEM). All projects approved by their local utility after April 14, 2023, will be established on the new NBT, which slashes the export value of customer generated energy to a fraction of the retail cost of electricity. The CPUC unanimously approved the NBT last December, over the opposition of the solar industry and consumer advocates who are concerned that the loss of value could put renewable energy out of reach for many residential and commercial customers.
NV5 analysts have run the numbers for both commercial and residential projects in California. Projects in PG&E and SDG&E territories take the biggest percentage hit compared to NEM 2.0, while SCE projects will have the lowest absolute value of solar (see Figures 1 and 2.) Overall, the value of a typical commercial solar PV project will drop by an average of 25%, with the highest losses in PG&E territory (30%), followed by SDG&E (27%) and SCE (19%). Residential solar PV customers will take an even worse hit, losing nearly half of their value compared to NEM 2.0 in PG&E territory.
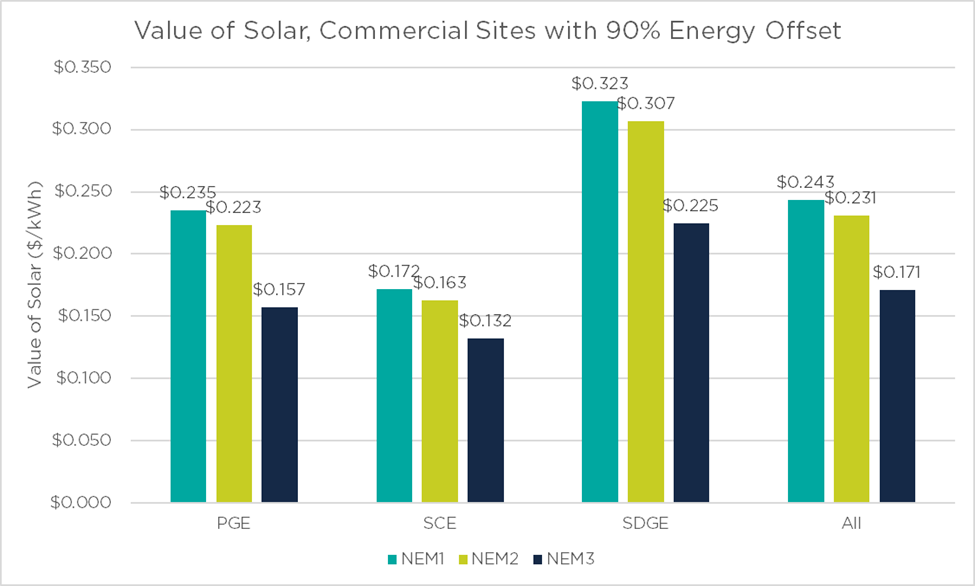
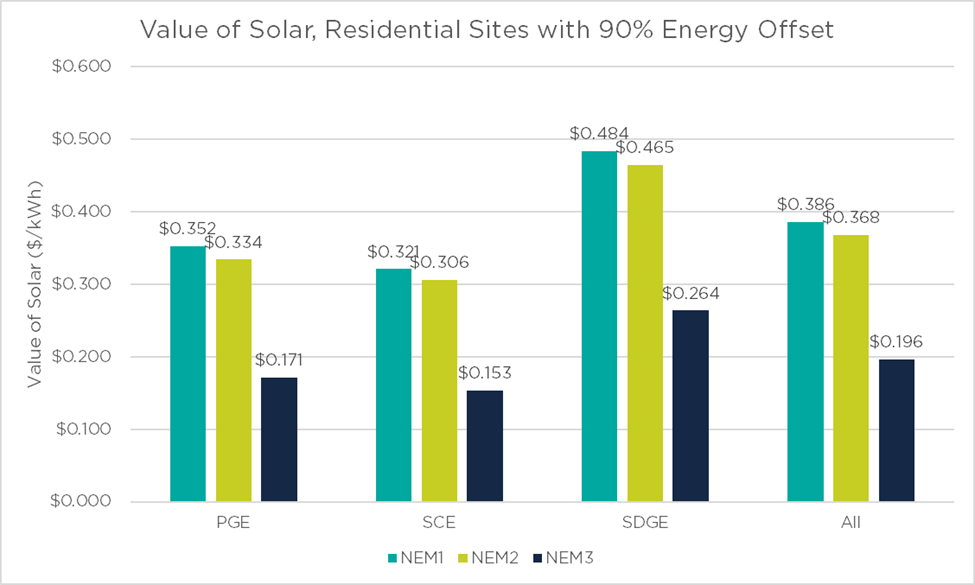
When NV5 models for solar PV value, we assume that the solar PV system be sized to offset about 90% of annual energy consumption, as was typical under NEM 1.0 and NEM 2.0, to maximize value. However, under the Net Billing Tariff, systems that offset less of a customer’s load have a higher average value of solar PV by reducing the amount of exported energy. Our modeling shows that the more a solar PV system offsets annual consumption, the larger the gap between NEM 2.0 and NBT values (see Figures 3 below.)
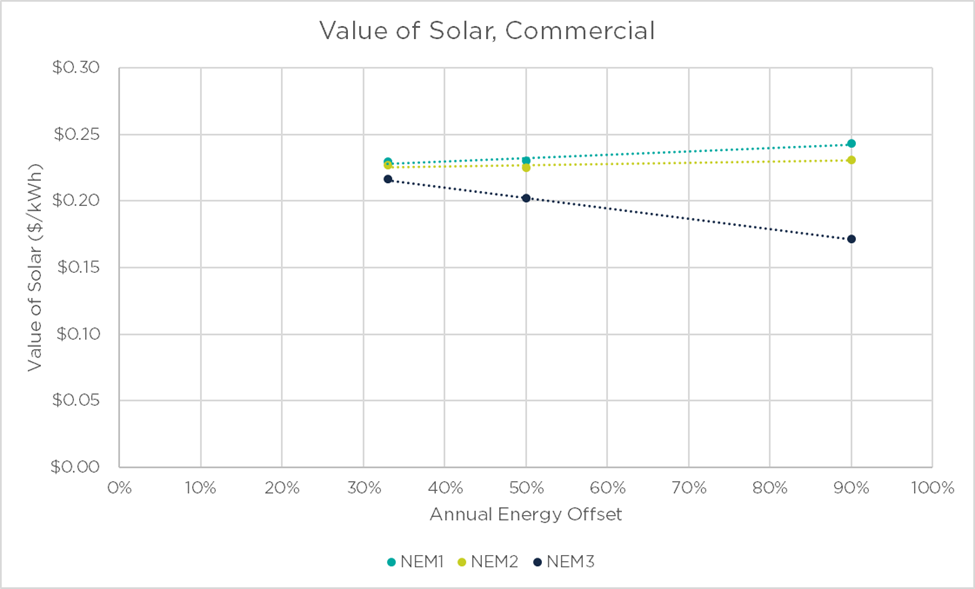
To maximize the value of solar PV energy, commercial solar PV system installed in California under the Net Billing Tariff would need to be sized so that it does not export a significant amount of energy, typically about 33% of annual consumption. Under prior versions of NEM, the maximum value of solar was achieved by offsetting around 90% of annual consumption.
The NBT therefore incentivizes solar customers to install much smaller systems. However, this creates several problems: smaller systems are more expensive on a $/W basis due to economies of scale with installation and soft costs; smaller systems generate significantly less savings, making the decision to invest in solar much less compelling; and smaller systems work against the state of California’s goals and mandates for transition to a low carbon economy. Many customers may decide against moving forward with solar due to the expense and lack of return.
The Net Billing Tariff Encourages Energy Storage – But It May Not Pencil Out
One priority of the CPUC with this decision is explicit: to encourage the installation of battery energy storage systems (BESS) in the state. Because exported energy is worth far less than the retail cost of energy imported from the grid, customers now have an incentive to use as much solar PV energy generated onsite as they can. In most cases, batteries will be needed to store the extra energy produced during the middle of the day to offset energy use in early evening and at night.
Unfortunately, because of the high cost of batteries (as of this writing, typically $1,500-$2,500/kWh installed cost for commercial systems) and existing utility tariffs, adding batteries to solar projects typically adds relatively little economic value. Thus, solar plus storage project returns usually lean heavily on the solar PV returns. Lowering the value of solar PV with the NBT makes it much harder for a project to “catch up” and provide a compelling return on investment using batteries. Moreover, there are often long lead times of up to or more than a year for batteries, which can complicate project timelines.
One other challenge is so-called “solar-friendly” tariffs. These tariffs typically have higher energy rates in exchange for lower demand rates. This means that many solar customers have relatively fewer demand costs to cut with storage. Storage combined with solar may still prove financially feasible for many California customers, particularly with the recent expansion of the federal Investment Tax Credit (ITC) under the Inflation Reduction Act (IRA) passed in 2022. But as we’ve seen, this may not be as straightforward a value proposition as the CPUC hopes.
Additional Cost Considerations
Historically, commercial energy customers in California are billed in 15-minute intervals, compared to 1-hour intervals for residential. In what’s known as “interval netting,” utilities keep track of how much energy is used and how much is generated by solar PV. For the sake of simplicity, let’s assume that a residential customer is on a flat rate tariff of 10 cents per kWh. In the course of one hour, they use 2 kWh of energy (20 cents worth) and their solar PV generates half that, 1 kWh. With interval netting, this would be treated as a net import of 1 kWh drawn from the grid after a bill credit of 10 cents for the generated energy, so the customer would pay only 10 cents for the hour.
But with the Net Billing Tariff, things change. The energy consumption and solar PV generation may not have occurred at the same time. In the most extreme example, say that all the consumption happens in the first half of the hour, and all the PV generation happens in the second half. Under NBT, there is no interval netting–so our unfortunate customer would be charged for their 2 kWh of consumption and then receive the reduced value (let’s say 5 cents) for that 1 kWh of production exported to the grid. In other words, without interval netting, the PV generation may not be fully credited to energy use within an interval.
The NBT modeling shown earlier in this white paper was done using 15-min (commercial) and 1-hour (residential) intervals, which assumes interval netting. Without historic consumption data that reflects the lack of interval netting, there is no straightforward way to reconfigure our models to show the impact of this change. One proxy calculation used in the CPUC’s final Net Billing Tariff decision suggests they expect residential customers to export around 6.6% more PV-generated energy without netting.
What this means is that, even with the drastic reduction in value of NBT under our current analysis, the real-world impacts are likely to be worse. The amount of energy consumption that will no longer be offset by solar PV without interval netting will be situational and site-specific.
The takeaway is clear: the Net Billing Tariff dramatically reduces the value of both residential and commercial solar PV in California. In most cases, battery energy storage is not yet available or compelling enough financially to offset the loss. Solar customers, and those planning solar PV, must be wondering why the CPUC would disincentivize solar even as the state works to meet its zero carbon goals. If you need help navigating the ins and outs of the new Net Billing Tariff and better understand how it impacts your solar PV projects, please reach out to us.