Introduction and Justification
Ever increasing IT densities and AI workloads are leading to denser heat rejection in a smaller footprint. Location of key critical equipment is essential to ensure minimal to no impact to the expected performance of these units. External analyses can help guide optimal design decisions around equipment location and shed insight into unforeseen performance impacts.
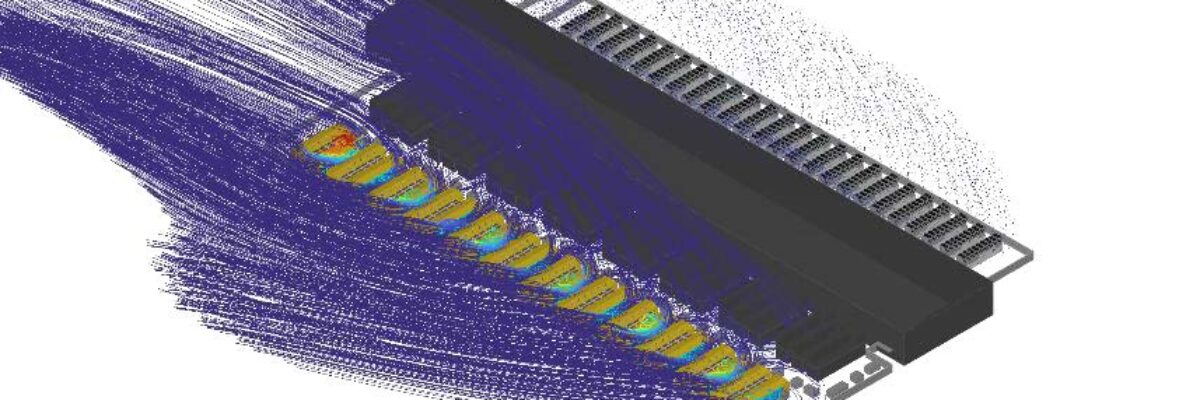
Computational Fluid Dynamics (CFD) in external applications resolves the airflow around buildings by numerically solving the Navier-Stokes equations in discretized form. External CFD modeling is highly recommended according to The Green Grid to confirm air flow patterns for engineered site conditions of proposed equipment layout [1]. Using representative climate data, the proposed equipment planning can be modeled and modified to maximize cooling effectiveness. In addition, the mean flow patterns and turbulence of wind passing over buildings can shed insight into recirculation of generator exhaust gases into air intakes, impacting air quality and possibly derating equipment performance. The complex wind flow patterns around data center buildings cannot be fully understood using first principles and computational fluid dynamics modeling is able to help characterize the wind flow patterns based on the site-specific geometries and adjacent site conditions as individual flow patterns can interact, yielding higher complexity.
The Green Grid (TGG) recommends CFD in the most recent performance assessment tool for the Levels 3 and 4 Performance Assessments [1]. In these advanced assessments, a physics-based CFD model is utilized and calibrated to allow for highly accurate calculated metrics to simulate failure scenarios, full design capacities, and operational plans.
| Level of Detail | Predictive Simulation | |||
|---|---|---|---|---|
| Current State | Future States | CFD Model | Fully Calibrated CFD Model | |
| Level 1 | Basic | N/A | ||
| Level 2 | Advanced | N/A | ||
| Level 3 | Basic/Advanced | Basic | ✓ | |
| Level 4 | Advanced | Advanced | ✓ | ✓ |
Even though manufacturers typically provide recommended clearances for equipment, often times the situation can be more complex than the manufacturer intended. For example, the equipment can be sited near a combination of factors that can create a complex scenario that may not necessarily match exactly with the guidance. Furthermore, the testing data generated to ascertain the clearance distances may be completely different from the site-specific climatic conditions.
When should external CFD modeling be engaged?
Ideally, external CFD modeling should be executed between schematic design and design development documents milestones. Prior to that, the model may be too simplified due to lack of design decisions during schematic design and the probability of changes needing more simulations to be run.
Waiting until post-construction to prove out thermal resilience is generally not recommended as any engineering modifications to the site will need to be coordinated with onsite operations without disrupting uptime.
What scenarios should be considered in the analyses?
The following scenarios are a general outline of the typical scenarios considered in an external analysis:
- Normal Steady-State Operation at 100% Load
- No-Wind
- Prevailing Wind at Extreme Conditions
- Worst Site Conditions (may not necessarily be the prevailing direction and takes engineering judgment and intuition to determine – the client may also request 2nd and 3rd prevailing wind directions.
- Post-Failure Mode when all cooling equipment runs at 100% of Rated Design and generators operating with 100% expected heat rejection, intake, and exhaust airflows
- No-Wind
- Prevailing Wind
- Worst Site Conditions
Ambient Temperature Design Points
The capacity of all equipment that rejects heat to ambient are determined at the Extreme Annual Design Conditions according to ASHRAE Handbook Fundamentals [4]. Extreme ambient conditions must be considered for anything that can impact capacities, loads, or equipment operation, such as miscellaneous condensing units and outdoor units. ASHRAE Weather Data contains the ambient dry-bulb and wet-bulb (if necessary) temperatures corresponding to return periods as required by the SLA/owner requirements [2].
With the increasing climate risks due to global warming, the ambient temperature state is important as any uplift in intake temperatures to key equipment will be based on this initial state. The Uptime Tier Institute Topology specification, as well as many data center owner operators, references at least a 20-year return period (N = 20) temperature as the design maximum values for both Dry-Bulb and Wet-Bulb temperatures. The latter is important to model for evaporative equipment (i.e. cooling towers, fluid coolers, swamp coolers, direct/indirect evaporative (DEC/IDEC) equipment, dedicated outdoor air units, etc.), for which performance is directly impacted by the ambient humidity conditions. For air-cooled equipment (i.e. air-cooled chillers, dry coolers, direct-expansion (DX) equipment, etc.), dry-bulb temperature alone is sufficient to capture equipment performance.
First step in determining extreme weather conditions is to identify the closest weather station to the site and to identify the following inputs:
- Prevailing Wind Direction(s)
- Mean Coincident Wind Speed
Sources of Wind Data
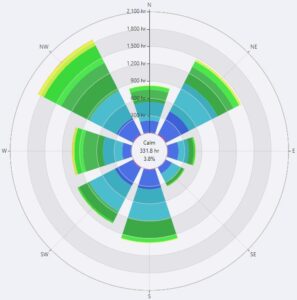
For any given location, one wind direction always has a higher frequency of occurrence called the prevailing wind. Probability distribution functions, such as the Weibull Distribution or the Rayleigh Distribution is often fit to the observed wind speed data as different locations will have different wind speed distributions.
Wind Roses can be important tools to ascertain probable wind directions. Typical Meteorological Year (TMY) data is a representation of weather data for every hour in a year for a given location, typically selected for a data set of 10 years or more, that is considered the most “typical” for that month.
The experienced modeler will be able to generate a model that is representative of the facility and site, while making simplifications to the model that are not expected to largely impact the flow patterns expected, allowing for shorter computation times and greater iterations for optimizations. The accuracy of the simulation is driven by the quality of the inputs to the model, which commonly include equipment configuration, equipment performance data, locations and sizes of site and adjacent buildings, grade, domain boundaries, and control systems.
The discretization of the model should be such that the results achieve grid independence and are fine enough to resolve high gradients in temperatures, pressures, velocities, etc.
Minimum Inputs
- Site specific data
- All physical air barriers expected to largely impact airflow patterns on site
- Site plan drawings with accurate scale showing all buildings and equipment
- All building and equipment intake and exhaust locations
- Technical data sheets and derating tables for all critical equipment
Atmospheric Boundary Layer
Resolution of the boundary layer is critical in any CFD model, ensuring good resolution to capture shear effects near wall boundaries, and this is especially true for external modeling. Logarithmic wind profiles are used to estimate the approaching wind based on the roughness classes and associated length scales best suitable for your data center sites.
Acceptance Criteria
The acceptance criteria, the conditions for which the proposed design shall be accepted by the client, should be fully understood by the modeling team prior to analysis:
- Modeled outside air intake temperature and humidity conditions at the equipment intakes match the equipment selection criteria
- Adjacent unit operation and airflow influences do not result in derating of equipment capacities below required redundancy.
Pollutant Dispersion and Exhaust Reentrainment
This type of analysis can be important in understanding the design decisions of intakes and exhaust locations relative to the pollutant and exhaust sources. Intakes and exhausts should be chosen carefully, considering wind direction and roof geometries, to avoid undesired intake contamination and exhaust reentrainment. Contaminants will not always be transported along the approach direction and can be advected windward going against intuition if subjected to vortices and adverse pressure gradients near the building.
Derating of Critical Equipment Performance
Manufacturers should be able to provide testing data for equipment upper limits of incoming ambient temperature and the impacts on cooling performance:
- Air-Cooled Chillers – High head shutoff, compressors can be compromised, condensing unit heat rejection can be compromised as the temperature difference between the condenser coils and ambient can be smaller.
- Cooling Towers – High wet-bulb temperatures can decrease evaporative efficiency, increasing your condensing water supply temperatures.
- Make Up Air Units – High intake OA temperatures will lead to higher off coil temperatures, leading to increased supply temperatures in the data hall.
Minimum Outputs
The outputs delivered should comprehensively and concisely convey the external physics due to wind and no-wind to both technical and non-technical audiences alike. NV5 recommends the following outputs at a minimum:
- Engineering Assumptions
- Comprehensive wind analysis
- Thermofluid properties
- Key Velocity, Pressure and Temperature plots
- Power and Cooling equipment summaries
- Conclusions and Recommendations
External CFD analysis provides insight for operators, engineers, designers, and owners on the equipment performance impact of the site design during extreme conditions. NV5 can provide expertise on your next data center site to better inform design decisions to de-risk your facility and maximize thermal resilience, equipment performance, while minimizing downtime for you and your customers.
Contacts
Mission Critical – Americas
Andrew Chang, PE, LEED AP | Senior Vice President | NV5
133 Technology Dr. #200 | Irvine, CA 92618 | M: 714.478.6155
Andrew.Chang@nv5.com
Mission Critical – APAC / UAE
Keith Cheong | Senior Vice President | NV5
Unit B, 5/F, 133 Wai Yip Street, Ngau Tau Kok, Kowloon | Hong Kong | M: +852 6802 9066
Keith.Cheong@nv5.com
Mission Critical – APAC / India
Gary Hui | Senior Vice President | NV5
Unit B, 5/F, 133 Wai Yip Street, Ngau Tau Kok, Kowloon | Hong Kong | M: +852 9820 9740
Gary.Hui@nv5.com
Author
John Han, PE, LEED AP BD+C, CEM is a Senior Mission Critical Mechanical Engineer with NV5.
References
[1] The Green Grid White Paper #68: The Performance Indicator: Assessing and Visualizing Data Center Cooling Performance[2] ASHRAE Weather Data Viewer Online. www.weather.ashrae.org
[3] ASHRAE Handbook – Applications Chapter 20. Data Centers and Telecommunication Facilities
[4] ASHRAE Handbook – Fundamentals Chapter 24. Airflow Around Buildings.
[5] Uptime Institute. Data Center Site Infrastructure Tier Standard: Topology